


Real-time KPIs: always up to date
All relevant KPI data (key performance indicators) is updated in real time. Companies keep track of the current status of their processes at all times and intervene immediately when needed.


The most important KPIs always in view.
With the 1st Log reporting tool you always keep an eye on your most important figures. Make well-founded decisions based on current, data-driven information – quickly and easily.
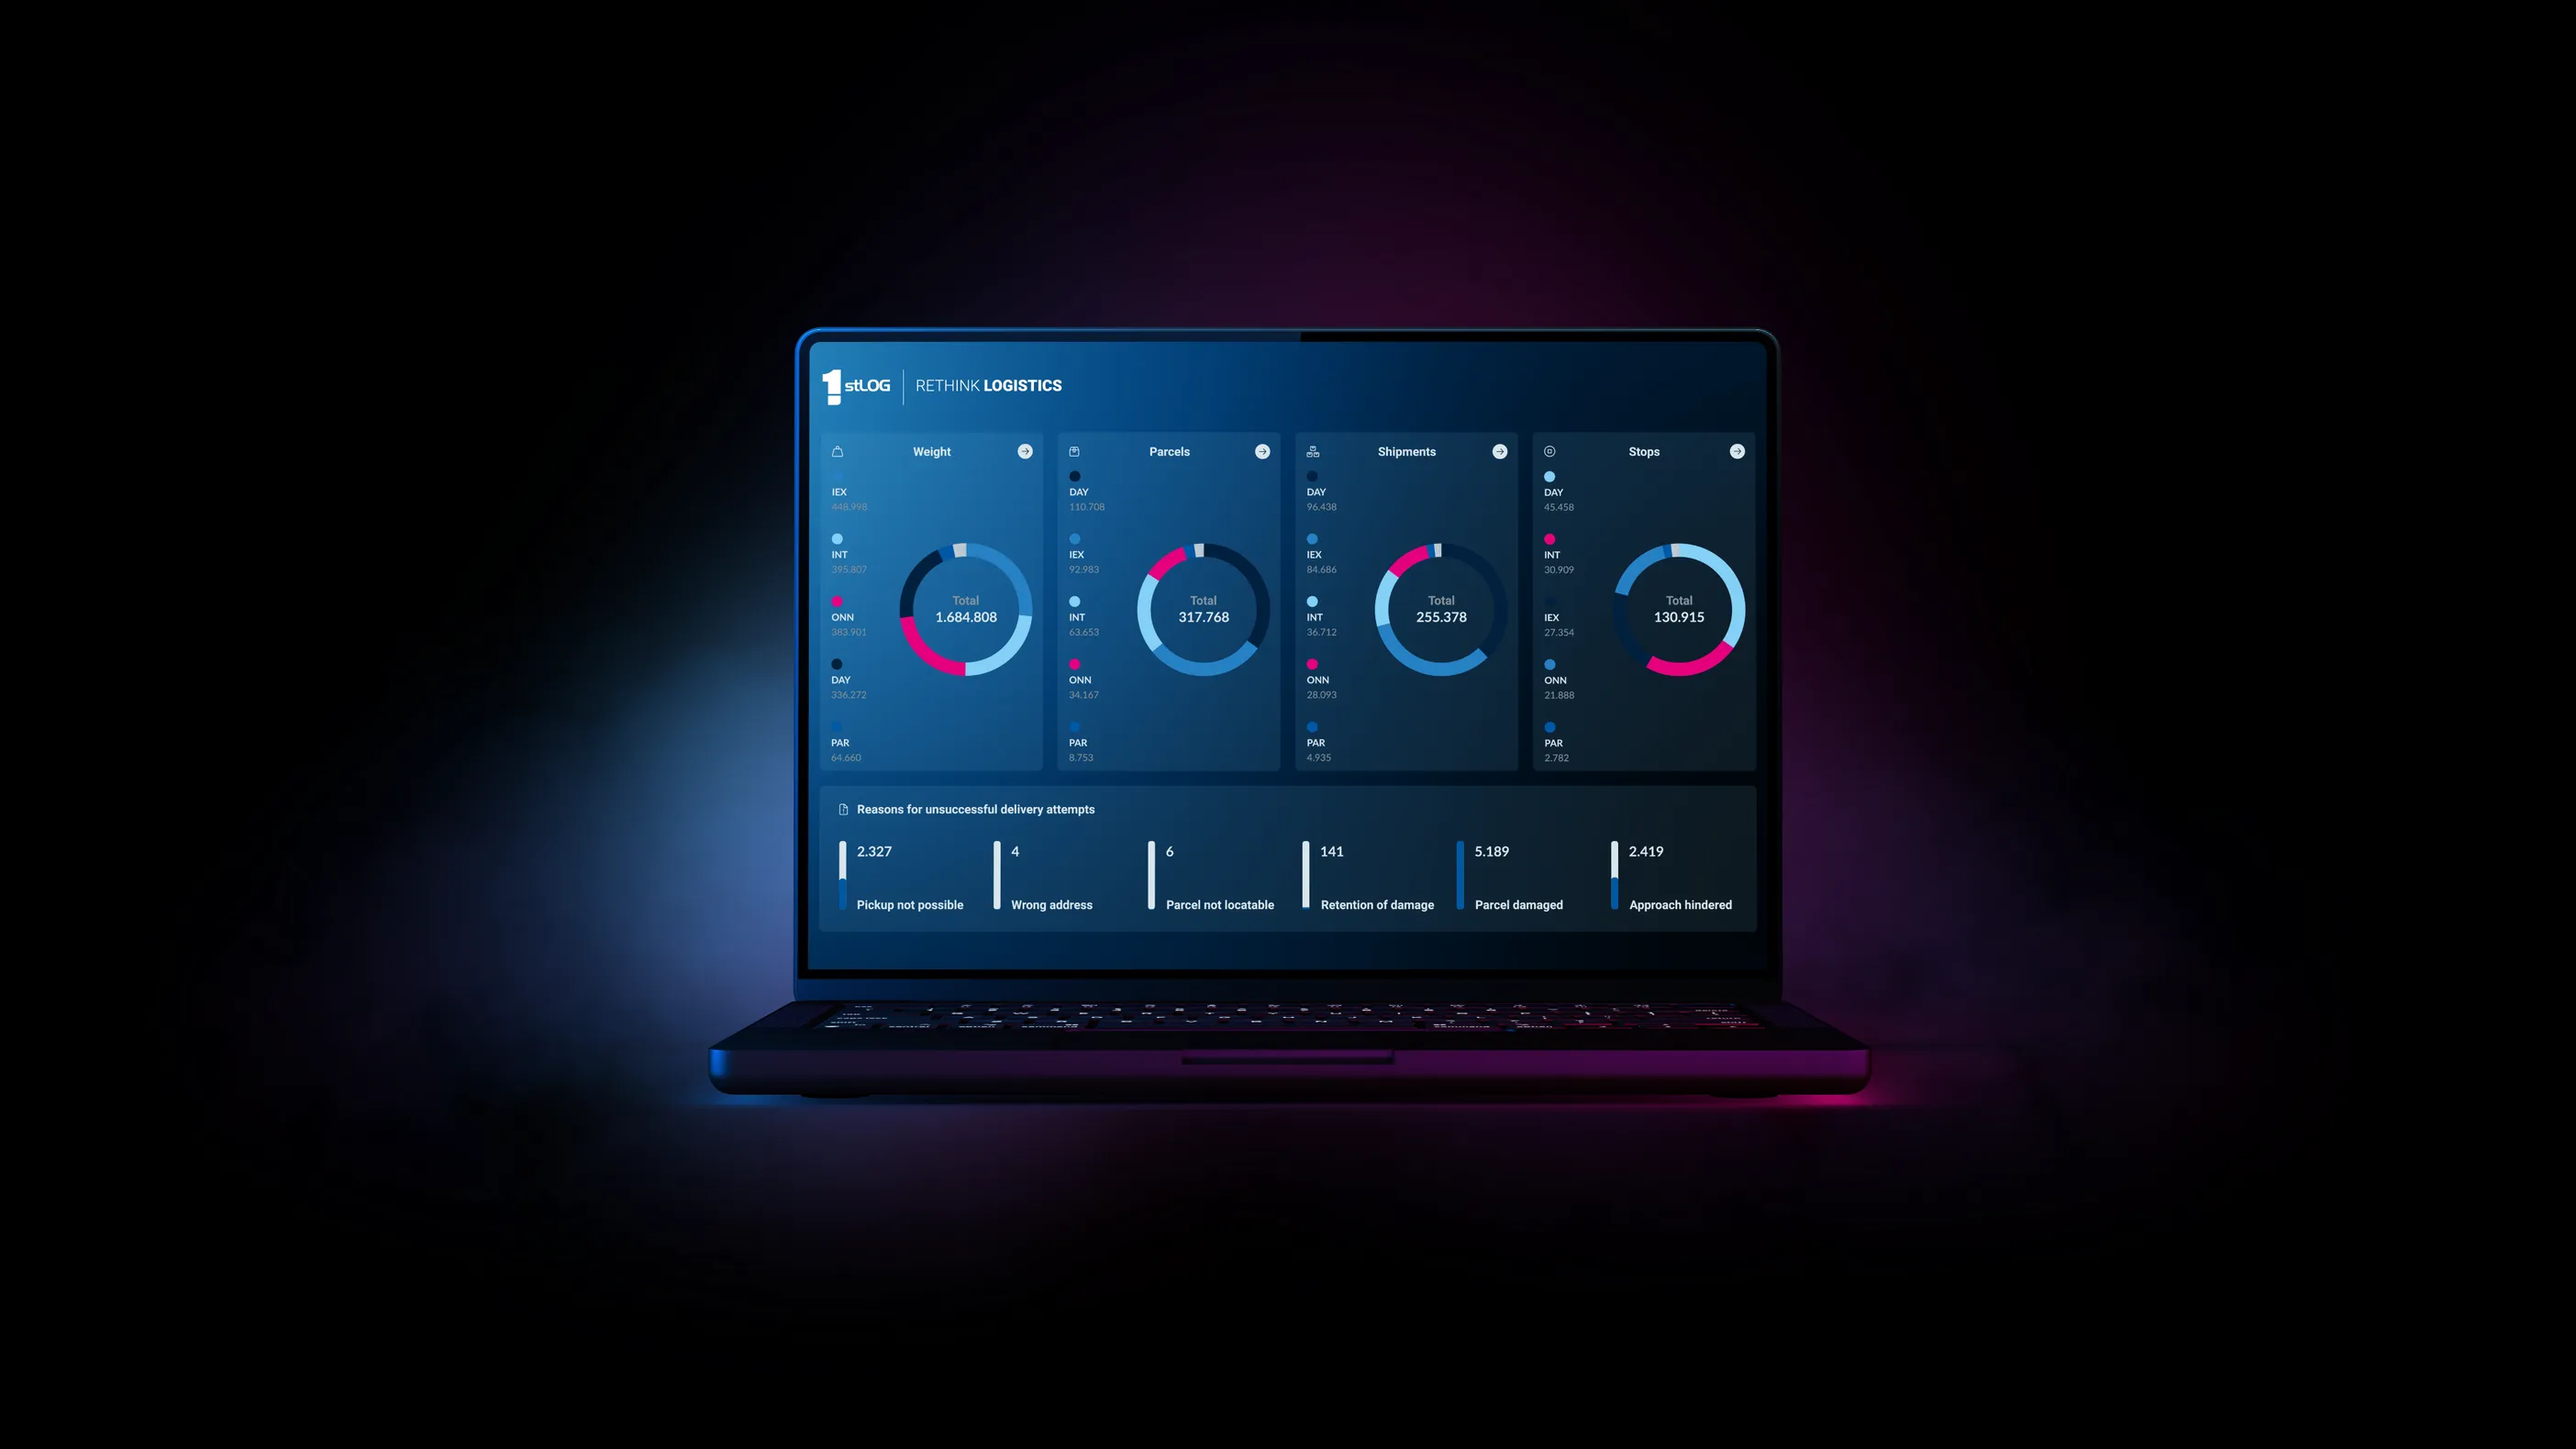
Individually in a few steps
Simply pick the figures you want and display them from a template or individually. With just a few clicks you arrange the data that matters to you clearly and to your needs.
Always up to date
Continuous access to current data is the best proof of the quality, quantity and performance of your company. Because the data is updated constantly, all information is always current and available at any time.
Data accessible anytime, anywhere
The web app gives you access to all relevant information at any time – on the go too. Create and share reports with colleagues quickly to make decisions in real time.
Functions, processes & features
All relevant KPI data (key performance indicators) is updated in real time. Companies keep track of the current status of their processes at all times and intervene immediately when needed.
Create detailed reports that create transparency and communicate the quality and performance of your company to the outside. These reports are shared directly with customers and contribute to long-term customer loyalty.

Create dashboards tailored precisely to your needs. With a wide selection of figures and widgets you visualise your most important KPIs and make them easily accessible. You find more on this under "Processes".

Sales, logistics or customer service – create several dashboards and adjust them individually to meet the requirements of different departments or projects.

Make strategic decisions based on current, data-generated information. This ensures well-founded measures and the long-term optimisation of your business processes.
Compare different KPIs, periods or departments quickly and easily. This function makes it easy to spot trends and take targeted action.

All important data can be exported as PDF or Excel files. This makes further processing in other systems and the presentation of results in meetings and reports easy.
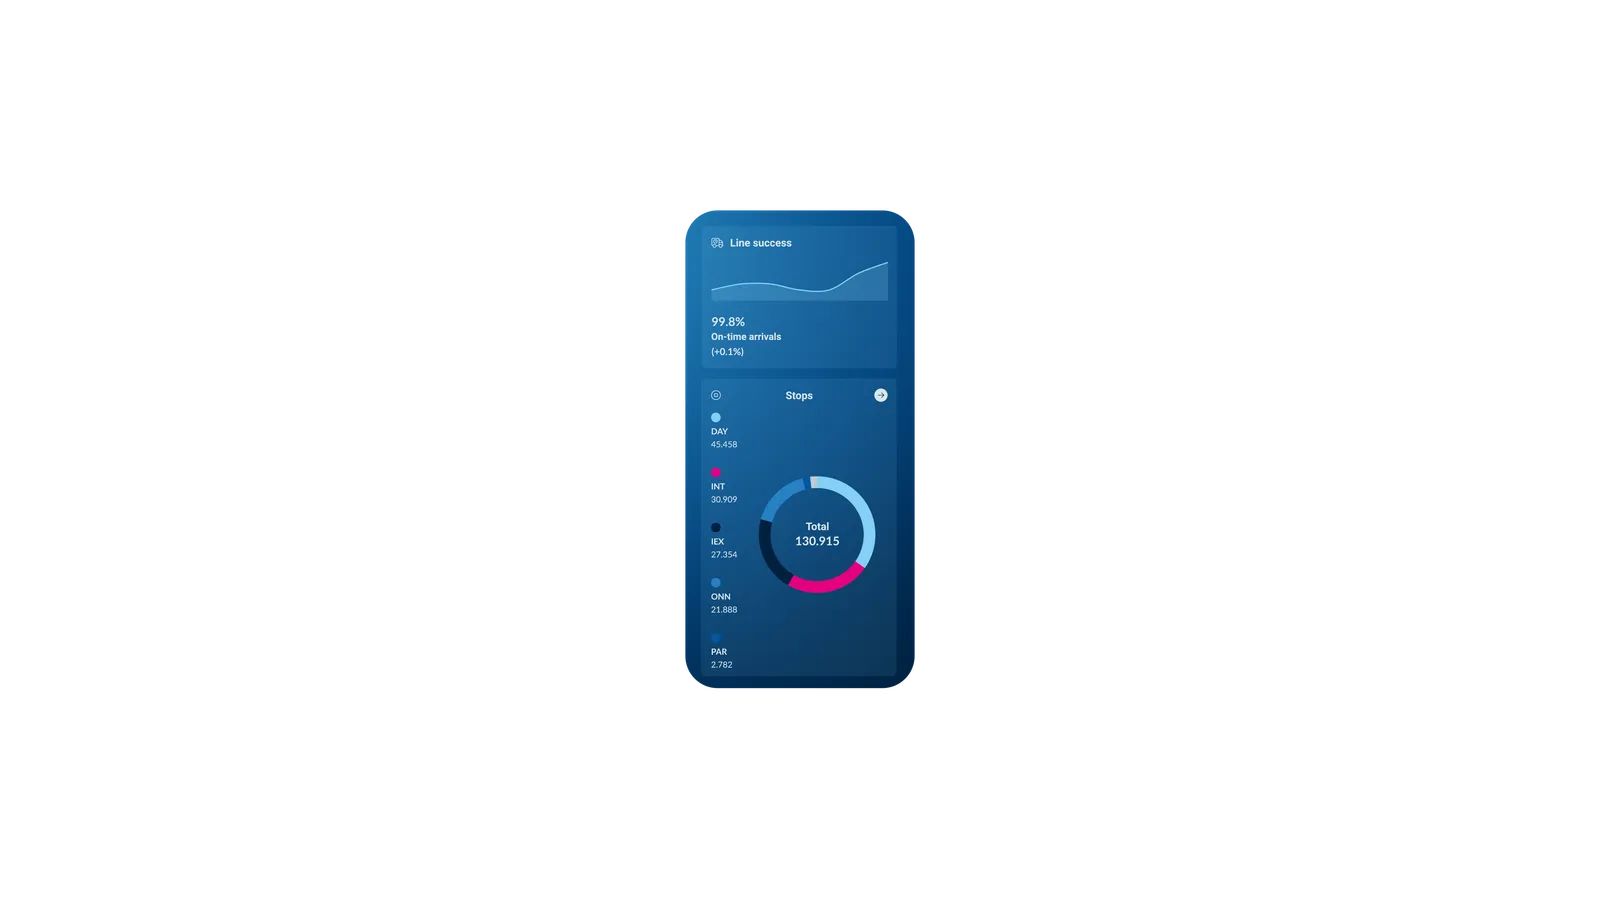
With the report app your data is available on the go at any time. Check important information in real time on your smartphone and react immediately.
Share relevant KPIs or reports with colleagues or customers straight from the app. This enables fast communication and decision-making wherever you are.

Every company has different priorities. Pick the figures that matter most to you and focus entirely on them.
Save frequently used dashboard configurations as templates. This saves time and allows quick reuse in future projects.
Compare figures across different periods – from daily to annual reports. Select the desired period with a few clicks and analyse your data accordingly.

Switch effortlessly between periods such as day, week, quarter or year. You keep the overview at all times and analyse data quickly and precisely.

Visualise all relevant data from your shipments, tours and lines at a glance. You keep a clear overview and analyse and use important information quickly.

The platform integrates not only your own shipment, tour and line data but also external data sources such as DHL or UPS. All relevant information in one place.
Give other users access to your dashboards. Share data and insights quickly and easily to promote better collaboration and decision-making.
Use the advantages of our software to make your logistics processes more efficient and less error-prone. Discover how our solutions help you save time and optimise your workflows. Would you like to know more?
| Feature | What it does for you |
|---|---|
| Dashboards | Create individual dashboards to visualise important figures. |
| Export function | Simple export as PDF or Excel for presentations. |
| Sharing function | Share dashboards with other users regardless of location. |
| Integration | Draw on external data sources for an even better overview. |
| Customer reports | Customer reports that strengthen customer loyalty for the long term. |
| Report web app | Share KPIs with colleagues on the go, too. |